Results & Discussion
Land use drives water quality in the headwaters which has a trickle-down effect to the catchment outlet
|
Land use and land cover drive water quality patterns in the headwater streams (Fig. 11-13). DOC and DIN concentrations in disturbed peatland subcatchments were significantly (p <0.05) higher than in non-disturbed catchments, including the mixed catchments where the water eventually flows. This indicates that land use sets the initial nutrient conditions in headwaters and then in-stream biogeochemical processes remove and retain nutrients as water and solutes are transported downstream [15, 25]. Of particular concern for this area are the elevated concentrations of DOC and TP, and the occasional spike of DIN from disturbed peatlands. Almost all subcatchments have DOC concentrations above the 7.90 mg/L water quality guideline for the preservation of aquatic life and safe drinking water. Though these streams are not drinking water sources directly, they do flow into the North Saskatchewan River which is a drinking water source. Even more concerning is the influence of elevated DOC on aquatic life. The average DOC concentration for these subcatchments is 48.31 mg/L and the average concentration in disturbed peatland subcatchments is 83.37 mg/L with maximum concentrations reaching 149.9 mg/L. Elevated DOC concentrations can reduce light penetration into the water column and affect trophic levels, including fish populations [7, 26]. Because these streams naturally drain wetlands, it is likely that aquatic life is more resilient to elevated DOC concentrations, but even shifts of 8 – 11 mg/L (shifts that are easily attained through peatland disturbance) can affect algae production and water column visibility [26].
TP is also consistently elevated in these subcatchments from headwaters to the catchment outlet (Fig. 11, 13). The recommended water quality guideline for TP is 0.10 mg/L, and the average TP concentration in these subcatchments is 0.23 mg/L with maximum concentrations reaching 1.98 m/L. There were no statistically significant differences nor little evidence to support that peatland disturbance contributes more P to the stream network than other land cover classes. Therefore, we can conclude that peat harvesting in this region effectively removes that upper peat layers where P is cycled. However, the fact that TP concentrations are so high is important for water quality managers because these catchments drain into the North Saskatchewan River. P has no known toxicity to humans, but P is a main contributor to algal blooms which remove oxygen from the water column and negatively affect aquatic ecosystems [21]. DIN concentrations were significantly (p < 0.05) higher in disturbed subcatchments than in other land cover classes (Fig. 11) and occasionally concentrations spiked above the recommended water quality guideline of 2.95 mg/L. On average across all subcatchments, DIN concentrations were 0.34 mg/L and in disturbed peatlands concentrations averaged at 1.23 mg/L and spiking upwards of 6.12 mg/L. As illustrated in Fig. 6 and 7, the majority of the DIN is ammonium which is a byproduct of organic matter breakdown and oxidation. Because disturbed peatlands have lower water tables, peat organic matter is able to be oxidized and transported downstream. Furthermore, there is no vegetation in harvested peatlands to take up the excess N. Fertilizer can also release DIN to streams, which is a common source of nutrients in agricultural landscapes. Indeed, in some agricultural regions it is not uncommon to see concentrations greater than 10 mg/L. However, in this system, maximum DIN concentrations in agricultural subcatchments only reached 4.85 mg/L and were lower than streams draining disturbed peatlands. Similar to P, DIN can trigger algal blooms which harm aquatic life. An overabundance of nitrate has also been linked to negative health effects in humans and ammonium can leave a bad taste in drinking water. Disturbed peatlands appear to have a strong influence on DIN concentrations, though concentrations rapidly decline as the water moves downstream to the catchment outlet (Fig. 13). Therefore, peatland harvesters should take measures to reduce DIN export from peatland catchments, which could further reduce DIN concentrations downstream. |
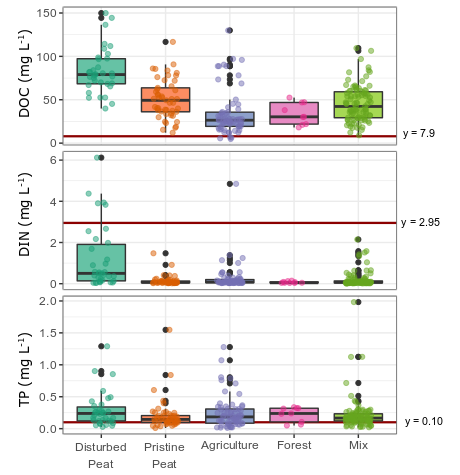
Fig. 11 Boxplots with data points overlain as jitter plots to show the relationship between land cover classes and nutrient concentrations. Horizontal lines show Alberta Water Quality Guidelines for this region of the North Saskatchewan River where Tomahawk and Deep Creek drain.
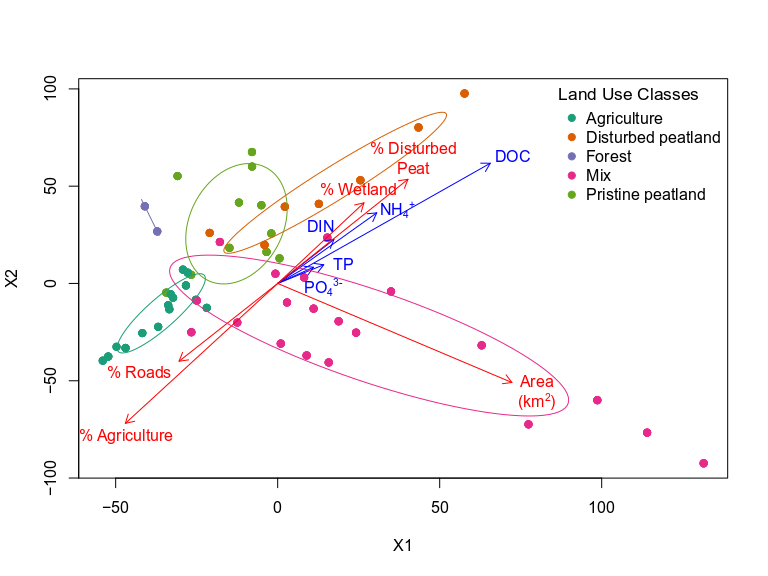
Fig. 12 Nonmetric multidimensional scaling (NMDS) analysis of geospatial catchment and water quality data. Points represent each subcatchment which are colored and grouped (with ellipses) by the dominant land use classes. Land use/land cover and water quality are highly correlated in the smaller catchments and headwaters, while downstream subcatchments are driven by other factors such as in-stream biogeochemical processing.
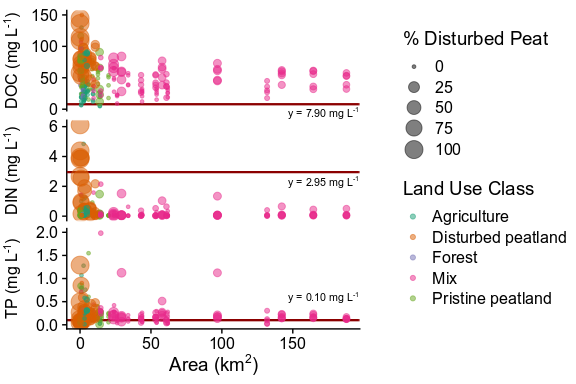
Fig. 13 Dissolved organic carbon (DOC) and nutrient concentrations decrease as catchment area increases (a proxy for position in the stream network). Horizontal lines show recommended water quality guidelines for protecting aquatic life and drinking water quality. Each point represents a water sample collected over the study period and points are sized by the proportion of disturbed peatlands in the catchment where that sample was collected. Points are also colored by land use class.
|
Water quality predictive modelling using geospatial catchment data
To further disentangle the relationship between peatland disturbance and water quality in mixed-use landscapes, I used Random Forest to predict water quality solely using geospatial catchment data. Concentrations of DOC, DIN, and TP in streams depend on complex interactions between the physical (i.e., soil, surficial geology, land use/land cover), biological (i.e., vegetation, animals, microorganisms), and hydrological (i.e., water flowpaths, precipitation) components of the landscape. However, land use and land cover are often important drivers of solute export in streams, especially in highly disturbed areas. Using Random Forest to predict solute concentrations further elucidates how disturbed peatlands control solute export in mixed-use landscapes.
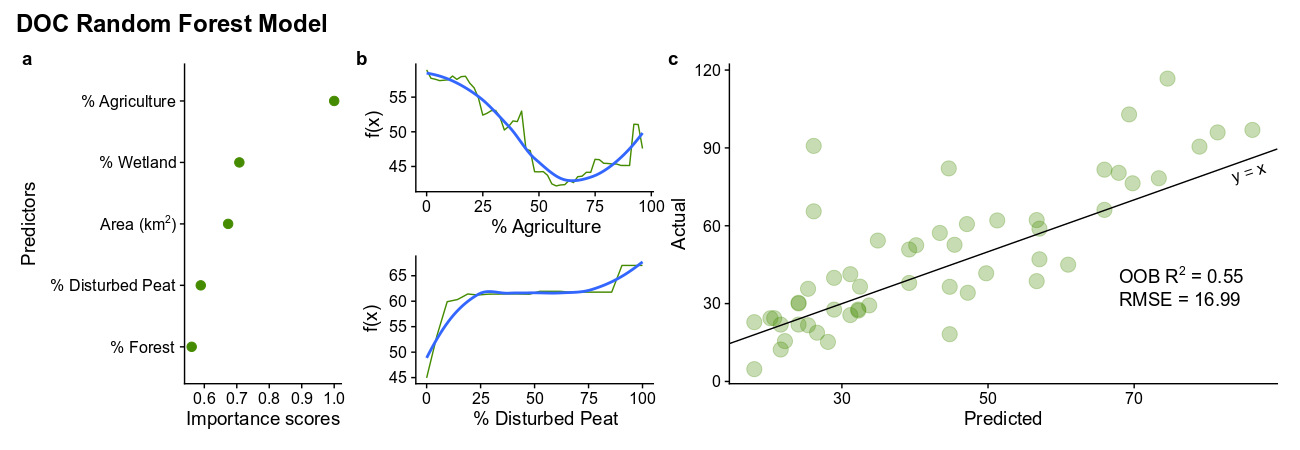
Fig. 13 Random Forest regression model predicting dissolved organic carbon (DOC) concentration. Predictor importance (a) shows the rankings of the explanatory variables included in the model ordered from most important at the top to least important at the bottom. Partial dependence plots (b) show the relationship of individual predictors or explanatory variables with the training data. For simplicity, I included the top ranking predictor and disturbed peat partial dependency plots. The smooth trendline is included to highlight non-linear relationships in the data. Predicted versus actual observations (c) show model performance with a 1:1 line (i.e., y = x) showing when predictions over or under-estimate the test data (data that was left out when training the model for the use of model validation).
The DOC model explains 55% of the variance in DOC concentration and identifies % Agriculture as the primary land use/land cover driver of DOC (Fig. 13a). The partial dependence plot depicts a sine-wave-like relationship with highest DOC concentrations occurring with low agricultural cover (Fig. 13b). Because % Agriculture and % Wetland are inversely correlated (Spearman correlation = -0.66), watersheds with low agricultural cover are likely to be dominated by wetlands. This is in line with previous findings that wetlands are dominant drivers of DOC export in watersheds. DOC concentrations bottom out around 60% agriculture and begin to rise again to 100% agriculture. Often, agricultural lands contribute high sediment loads due to soil erosion which contribute elevated concentrations of DOC, DIN, and TP, though the model shows that DOC concentrations from agriculture are still lower than DOC from wetlands. It is surprising that agriculture is a more important predictor than wetlands since many studies have reported wetlands as dominant drivers in other landscapes [22-24]. As mentioned above, agriculture and wetlands are inversely correlated in this landscape and perhaps including both land use/ land covers in the same model splits their importance. However, in single-predictor models, (i.e. DOC ~ % Agriculture vs. DOC ~ % Wetland) agriculture still out-performed wetlands as the most important predictor of DOC concentrations. This disparity between this study and other studies could be due to the emergence of Random Forest modelling that is able to account for non-linear relationships. As shown in Fig. 5, DOC increases with % Wetland almost linearly, while the partial dependence plot shows a curvilinear function describing the relationship between DOC and % Agriculture. This non-linear relationship may have been unutilized in other studies using predictive models, and highlights the usefulness of Random Forest with ecological data.
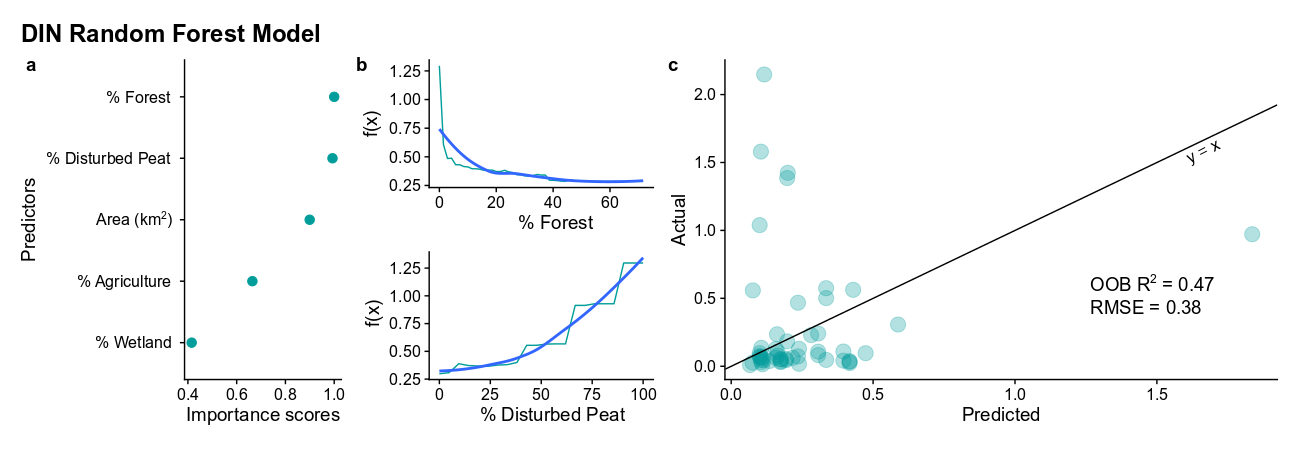
Fig. 14 Random Forest regression model predicting dissolved inorganic nitrogen (DIN) concentration. Predictor importance (a) shows the rankings of the explanatory variables included in the model ordered from most important at the top to least important at the bottom. Partial dependence plots (b) show the relationship of individual predictors or explanatory variables with the training data. For simplicity, I included the top ranking predictor and disturbed peat partial dependency plots. The smooth trendline is included to highlight non-linear relationships in the data. Predicted versus actual observations (c) show model performance with a 1:1 line (i.e., y = x) showing when predictions over or under-estimate the test data (data that was left out when training the model for the use of model validation).
Geospatial catchment characteristics explain 47% of the variance in DIN concentrations. % Forest and % Disturbed peat were the most important predictors. Partial dependence plots (Fig. 14b) showed that as % Forest increased, DIN concentrations decreased according to an approximately exponential function. Disturbed peat had the opposite effect, with DIN concentrations increasing with disturbance according to an almost linear function. The model tended to underestimate DIN concentrations (Fig. 14c), although most of the predictions grouped around the 1:1 (y=x) line.
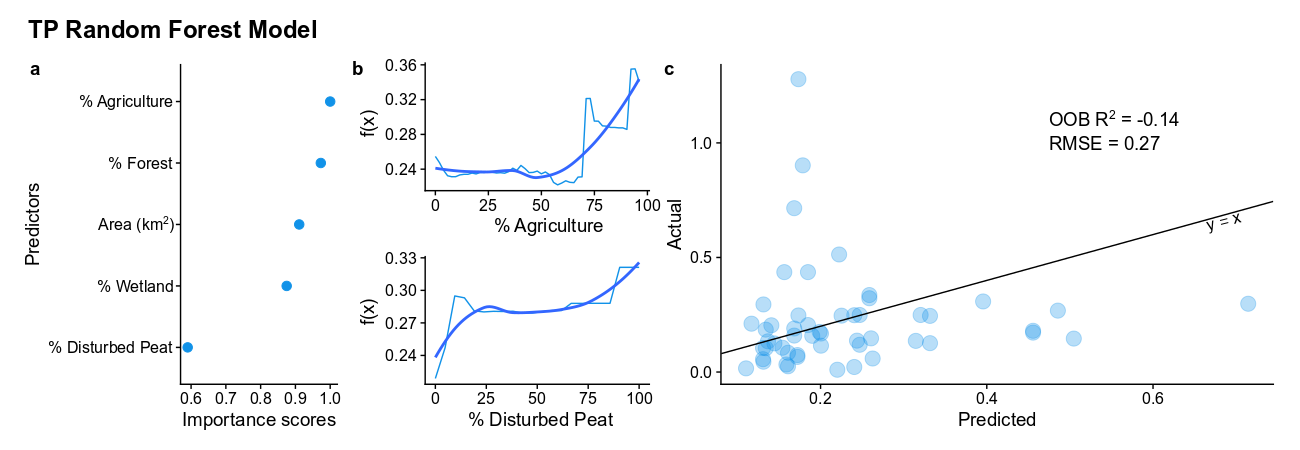
Fig. 15 Random Forest regression model predicting total phosphorus (TP) concentration. Predictor importance (a) shows the rankings of the explanatory variables included in the model ordered from most important at the top to least important at the bottom. Partial dependence plots (b) show the relationship of individual predictors or explanatory variables with the training data. For simplicity, I included the top ranking predictor and disturbed peat partial dependency plots. The smooth trendline is included to highlight non-linear relationships in the data. Predicted versus actual observations (c) show model performance with a 1:1 line (i.e., y = x) showing when predictions over or under-estimate the test data (data that was left out when training the model for the use of model validation).
Geospatial catchment characteristics explained only 14% of the variance in TP concentrations, indicating that other hydrological and biogeochemical conditions are more important drivers of TP concentration. However, % Agriculture as the most important predictor for TP concentrations which is consistent with other research which indicates fertilizer, manure, and soil erosion are important inputs of P to inland waters. Disturbed peat was the least important predictor, which supports findings from Fig. 10 that disturbed peat has no significant affect on TP concentrations. This is an important finding because peat harvesting companies have been cited by water quality agencies for excess P export. In this landscape at least, it does not seem that peat disturbance has any affect on P concentrations.
Conclusions
Disturbed peatlands contribute elevated levels of DOC and DIN (especially ammonium) to headwater streams, and in many cases these concentrations exceed regional water quality guidelines. There is little evidence that peat harvesting affects P concentrations, but TP levels also consistently exceed regional water quality guidelines. DOC and nutrient concentrations decrease as water flows to the catchment outlet, but elevated levels of DOC and TP are being released to the North Saskatchewan River. Peat harvesters should be aware of the impacts their activity has on local water quality and take steps to reduce export of DOC and DIN downstream. Random Forest models showed that peatland disturbance along with other land uses and land covers are major drivers of DOC and nutrient concentration, except for P. Further research is needed to understand how and when DOC and nutrients are removed or retained along the stream network to better understand the mechanisms that affect water quality downstream for future water quality monitoring.
